To manage reports:
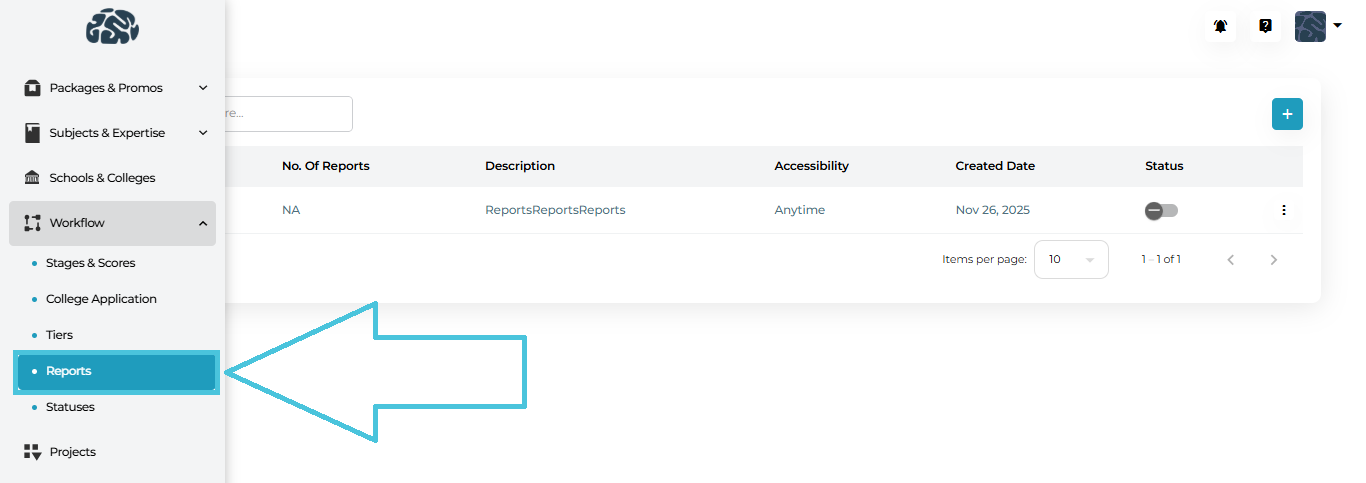
Open the Workflow section from the left navigation.
Click Reports.
You’ll see a list of all existing reports along with:
Number of report entries
Accessibility
Created date
Status (Active / Inactive)
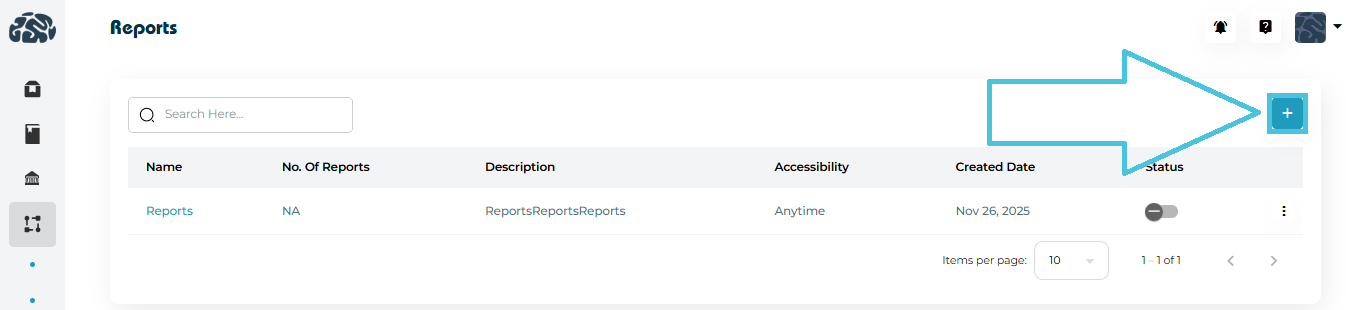
To create report:
Click ➕ Add New on the Reports page.
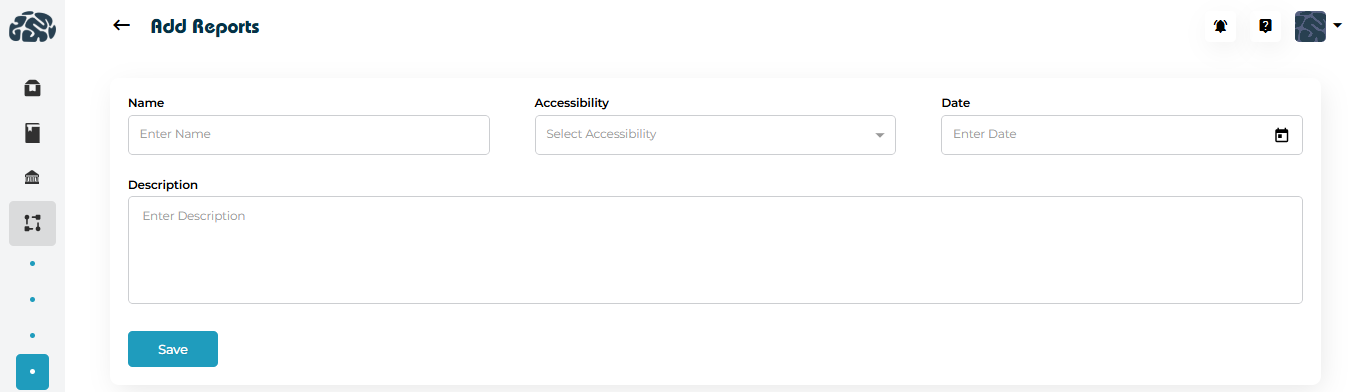
Fill in the core report details:
Report Name – A clear, descriptive title (e.g., Student Progress Report).
Accessibility – Define when the report can be accessed (e.g., Anytime or date-restricted).
Date – Optional availability or reference date.
Description – Explain the purpose of the report.
Click Save to create the report container.
At this stage, the report exists but does not yet collect any data until sections and fields are added.
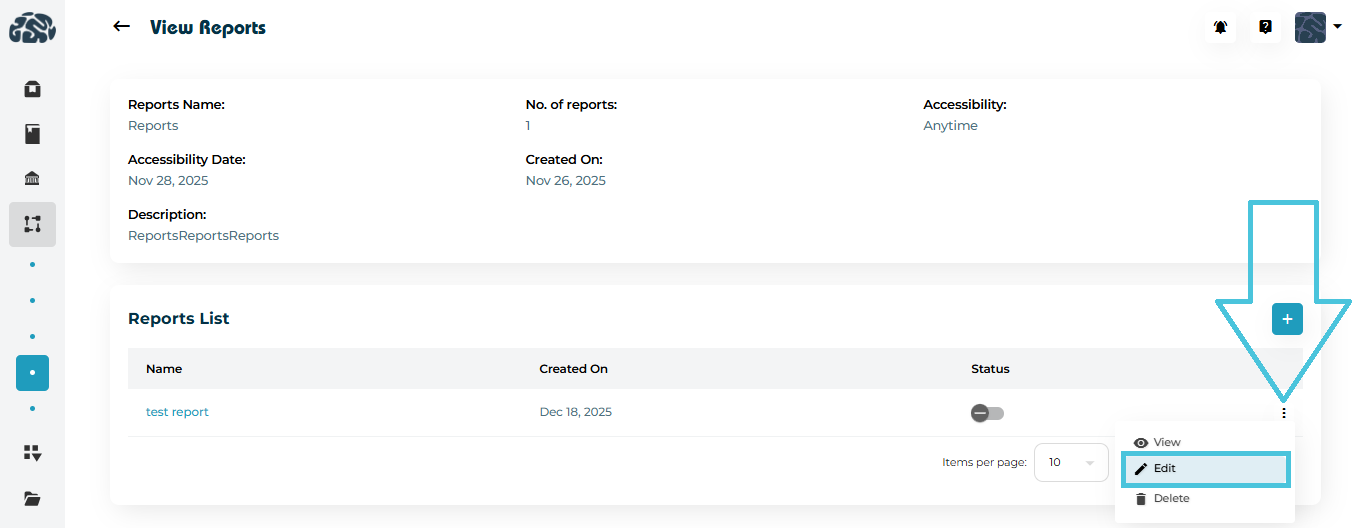
Each report can include multiple report entries (also called report sections).
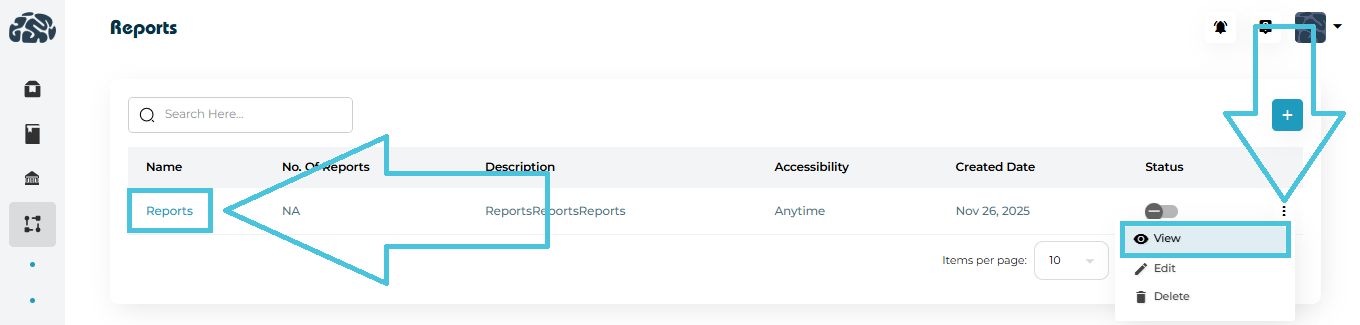
Open a report using either:
The View option from the three-dot menu, or
Clicking directly on the Report Name.
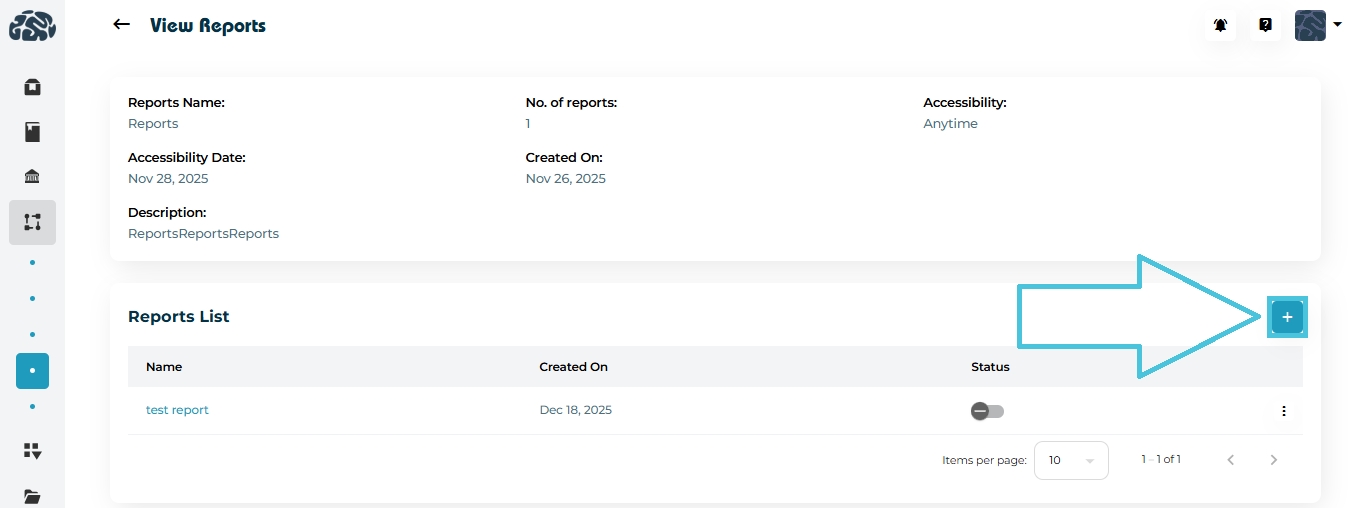
In the Reports List section, click ➕ Add.
Enter:
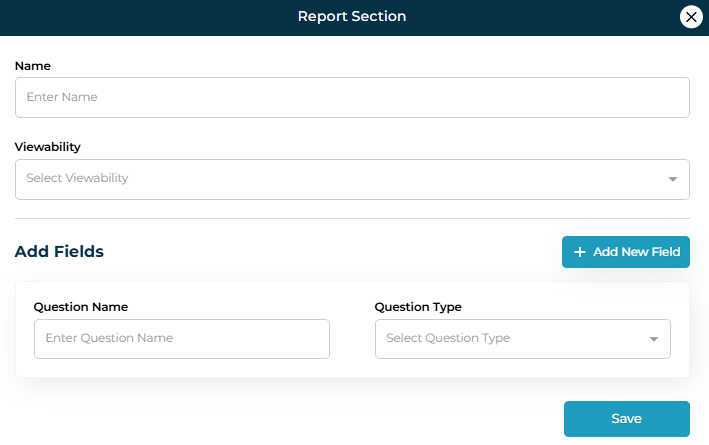
Section Name (e.g., Academic Evaluation).
Viewability – Control who can view or fill this section (students, counselors, or both).
Question Name – The prompt shown to users (e.g., What is the student’s current GPA?).
Question Type – Choose how data is captured:
Text
- Input
- Number
- Textarea
Dropdown
- Multiselect
- Radio
- Checkbox
Date
Save the field.
This allows a single report to capture different dimensions of analysis in a structured way.
Reports and their sections can be viewed in two ways:
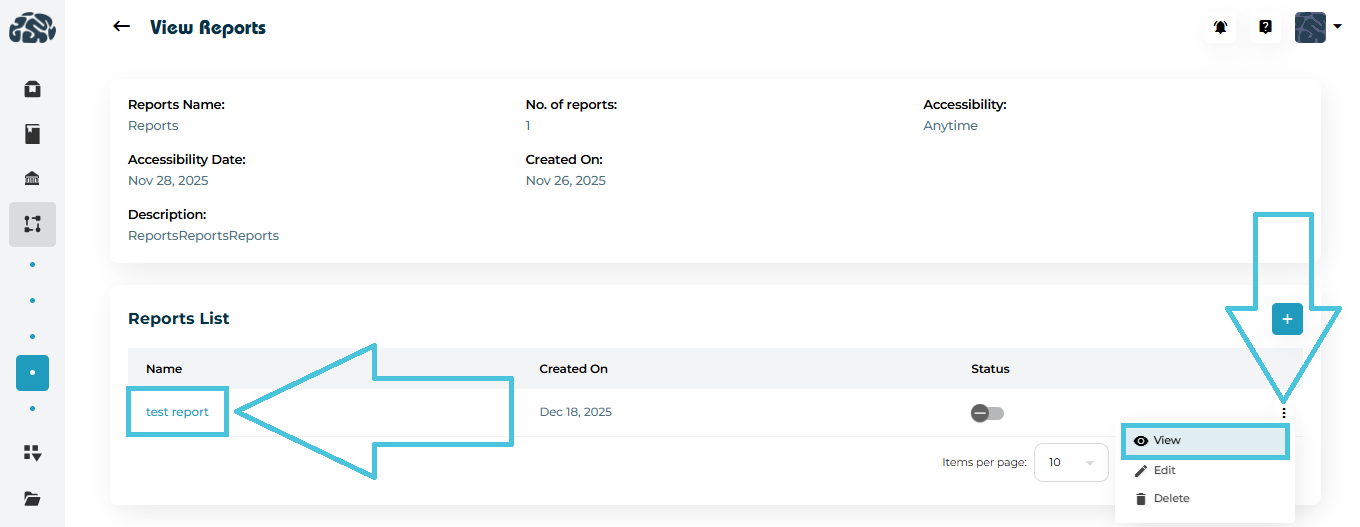
Clicking View from the three-dot menu, or
Clicking directly on the Report Name or Section Name.
The view screen displays:
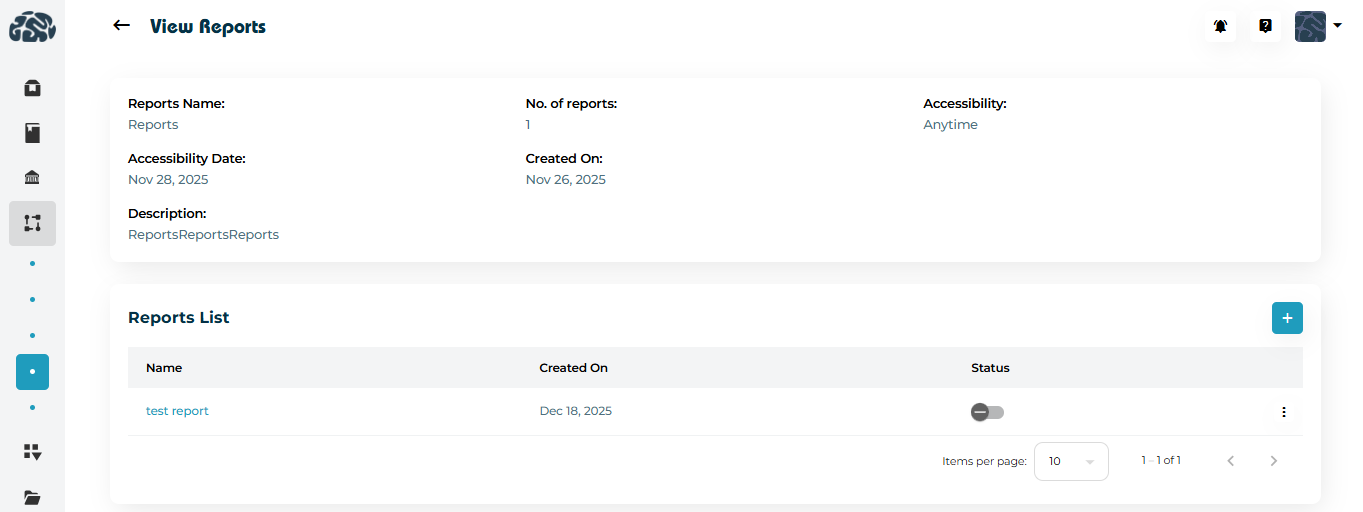
Report metadata (name, accessibility, created date)
List of report sections
Fields configured within each section
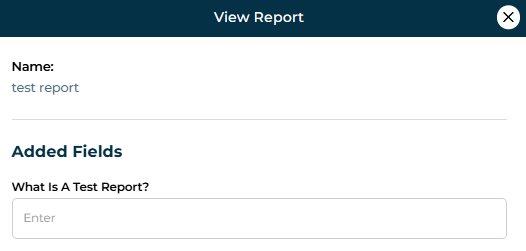
This makes it easy to audit report structure without editing.
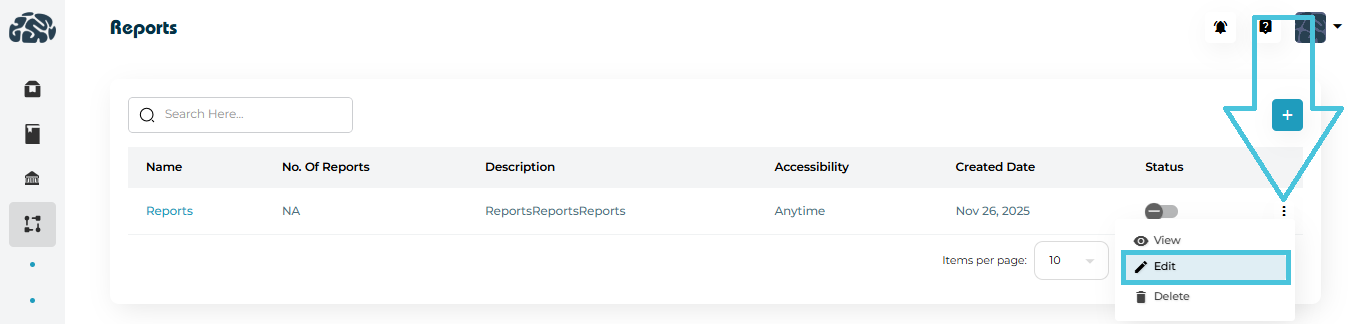
Administrators can update reports at any time:

Edit Report – Change name, accessibility, date, or description.
Edit Section – Modify section name or viewability.
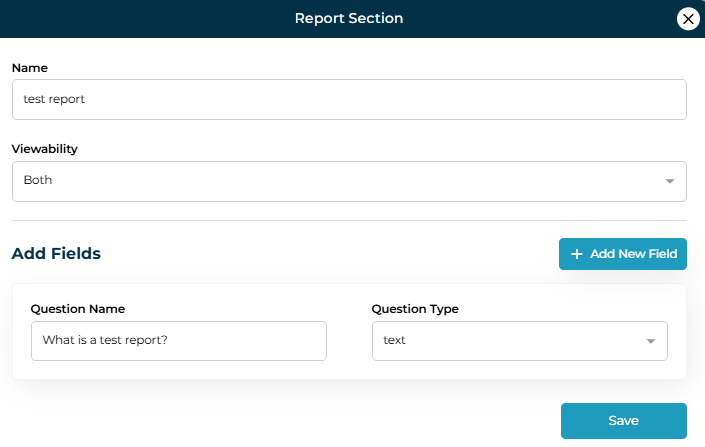
Edit Fields – Update question text or field type.
Edits apply immediately and help evolve reporting needs without recreating reports from scratch.
Each report and report entry includes a status toggle:
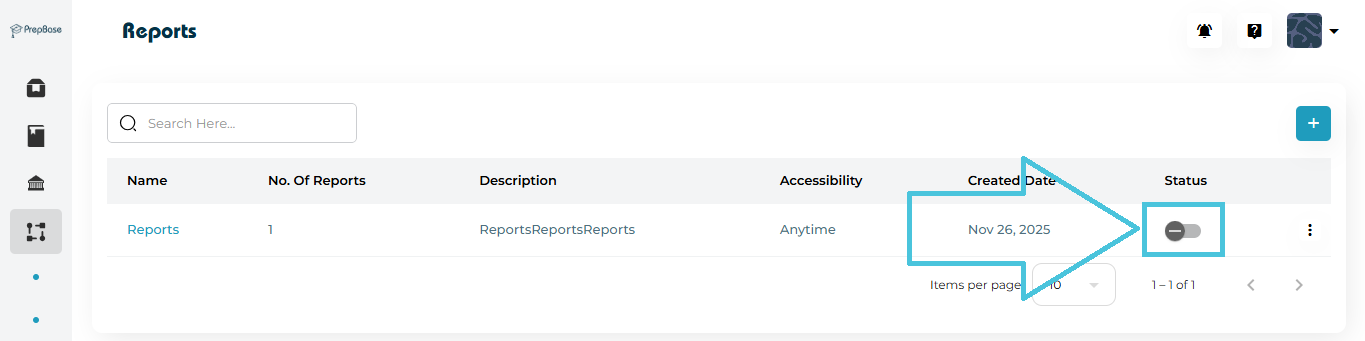
Enabled – Report is active and available for use.
Disabled – Report is hidden but preserved for future reactivation.
This is useful for seasonal reports, phased workflows, or archived analytics.
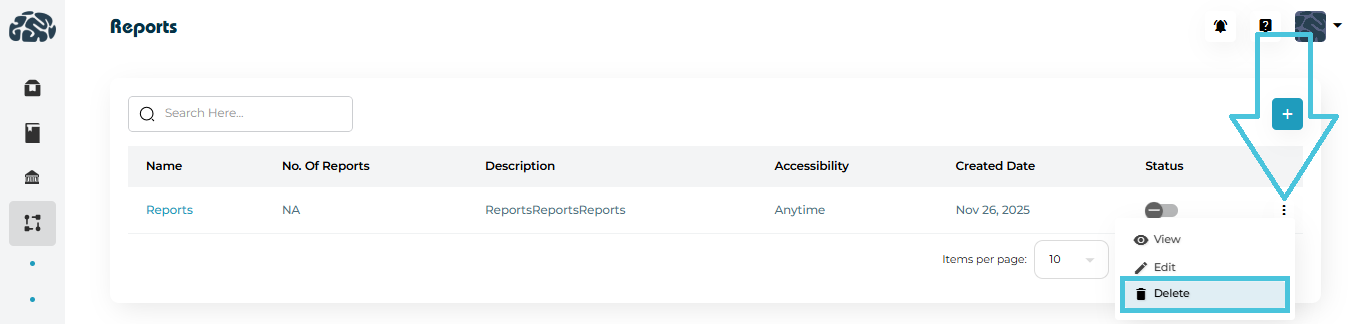
Reports or individual sections can be deleted using the Delete option from the three-dot menu.
Deletion should be used carefully, as it permanently removes the structure.
For temporary removal, disabling is recommended instead of deletion.